3. Using Stork
This section describes how to use the features available in Stork. To
connect to Stork, use a web browser and connect to port 8080. If
Stork is running on a localhost, it can be reached by navigating to
http://localhost:8080.
3.1. Managing Users
A default administrator account is created upon initial installation of Stork. It can be used to
sign in to the system via the web UI, with the username admin and password admin.
To see a list of existing users, click on the Configuration menu and
choose Users . There will be at least one user, admin.
To add a new user, click Create User Account. A new tab opens to
specify the new account parameters. Some fields have specific
restrictions:
- Username can consist of only letters, numbers, and an underscore (_).
- The e-mail field is optional, but if specified, it must be a well-formed e-mail address.
- The firstname and lastname fields are mandatory.
- The password must only contain letters, digits, @, ., !, +, or -, and must be at least eight characters long.
Currently, users are associated with one of the two predefined groups
(roles), i.e., super-admin or admin, which must be selected
when the user account is created. Both types of users can view Stork
status screens, edit interval and reporting configuration settings, and
add/remove machines for monitoring. super-admin users can also
create and manage user accounts.
Once the new user account information has been specified and all
requirements are met, the Save button becomes active and the new
account can be enabled.
3.2. Changing a User Password
An initial password is assigned by the administrator when a user
account is created. Each user should change the password when first
logging into the system. To change the password, click on the
Profile menu and choose Settings to display the user profile
information. Click on Change password in the menu bar on the left
and specify the current password in the first input box. The new
password must be entered and confirmed in the second and third input
boxes, and must meet the password requirements specified in the
previous section. When all entered data is valid, the Save button
is activated to change the password.
3.3. Configuration Settings
It is possible to control some of the Stork configuration settings from
the web UI. Click on the Configuration menu and choose Settings.
There are two classes of settings available: Intervals and Grafana & Prometheus.
Intervals settings specify the configuration of “pullers.” A puller is a mechanism in Stork which triggers a specific action at the specified interval. Each puller has its own specific action and interval. The puller interval is specified in seconds and designates a time period between the completion of the previously invoked action and the beginning of the next invocation of this action. For example, if the Kea Hosts Puller Interval is set to 10 seconds and it takes five seconds to pull the hosts information, the time period between the starts of the two consecutive attempts to pull the hosts information will be 15 seconds.
The pull time varies between deployments and depends on the amount of information pulled, network congestion, and other factors. The interval setting guarantees that there is a constant idle time between any consecutive attempts.
The Grafana & Prometheus settings currently allow for specifying the URLs of the Prometheus and Grafana instances used with Stork.
3.4. Connecting and Monitoring Machines
3.4.1. Monitoring a Machine
Monitoring of registered machines is accomplished via the Services
menu, under Machines. A list of currently registered machines is
displayed, with multiple pages available if needed.
A filtering mechanism that acts as an omnibox is available. Via a typed string, Stork can search for an address, agent version, hostname, OS, platform, OS version, kernel version, kernel architecture, virtualization system, or host-id field.
The state of a machine can be inspected by clicking its hostname; a new tab opens with the machine’s details. Multiple tabs can be open at the same time, and clicking Refresh updates the available information.
The machine state can also be refreshed via the Action menu. On the
Machines list, each machine has its own menu; click on the
triple-lines button at the right side and choose the Refresh option.
3.4.2. Deleting a Machine
To stop monitoring a machine, go to the Machines list, find the
machine to stop monitoring, click on the triple-lines button at the
right side, and choose Delete. This will terminate the connection
between the Stork server and the agent running on the machine, and the
server will no longer monitor that machine; however, the Stork agent process
will continue running. Complete shutdown of a Stork
agent process must be done manually, e.g. by connecting to the machine
using ssh and stopping the agent there. The preferred way to achieve that is to
issue the killall stork-agent command.
3.5. Monitoring Applications
3.5.1. Application Status
Kea DHCP applications discovered on connected machines are
listed via the top-level menu bar, under Services. The list view includes the
application version, application status, and some machine details. The
Action button is also available, to refresh the information about
the application.
The application status displays a list of daemons belonging to the application. Several daemons may be presented in the application status column, typically: DHCPv4, DHCPv6, DDNS, and CA (Kea Control Agent).
Eventually, when support for BIND 9 is added, the Stork agent will look for named in the
process list and parse the configuration file that is given with the
-c argument. If the named process is started without a
specific configuration file, the Stork agent will default to
/etc/bind/named.conf.
Stork uses rndc to retrieve the application status. It looks for
the controls statement in the configuration file, and uses the
first listed control point for monitoring the application.
Furthermore, the Stork agent can be used as a Prometheus exporter.
Stork is able to do so if named is built with json-c because
it gathers statistics via the JSON statistics API. The
named.conf file must have a statistics-channel configured;
the exporter queries the first listed channel. Stork is able to export the
most metrics if zone-statistics is set to full in the
named.conf configuration.
For Kea, the listed daemons are those that Stork finds in the Control Agent (CA) configuration file. A warning sign is displayed for any daemons from the CA configuration file that are not running. When the Kea installation is simply using the default CA configuration file, which includes configuration of daemons that are never intended to be launched, it is recommended to remove (or comment out) those configurations to eliminate unwanted warnings from Stork about inactive daemons.
3.5.2. Friendly App Names
Every app connected to Stork is assigned a default name. For example,
if a Kea app runs on the machine abc.example.org, this app’s default name
will be kea@abc.example.org. Similarly, if a BIND9 app runs on the machine
with address 192.0.2.3, the resulting app name will be bind9@192.0.2.3.
If multiple apps of a given type run on the same machine, a postfix with a
unique identifier is appended to the duplicated names, e.g. bind9@192.0.2.3%56.
The default app names are unique so that the user can distinguish them in the dashboard, apps list, events panel, and other views. However, the default names may become lengthy when machines names consist of fully qualified domain names. When machines’ IP addresses are used instead of FQDNs, the app names are less meaningful for someone not familiar with addressing in the managed network. In these cases, users may prefer replacing the default app names with more descriptive ones.
Suppose there are two DHCP servers in the network, one on the first floor,
second on the second floor of the building. A user may assign Floor 1 DHCP
and Floor 2 DHCP names to the respective DHCP servers in this case.
The new names need not have the same pattern as the default names and may
contain whitespace. The @ character is not required, but if it is present,
the part of the name following this character (and before an optional %
character) must be an address or name of the machine monitored in Stork.
The following names: dhcp-server@floor1%123 and dhcp-server@floor1,
are invalid unless floor1 is a monitored machine’s name. The special
notation using two consecutive @ characters can be used to suppress this
check. The dhcp-server@@floor1 is a valid name even if floor1 is
not a machine’s name. In this case, floor1 can be a physical location
of the DHCP server in a building.
To modify an app’s name, navigate to the selected app’s view. For example,
select Services from the top menu bar and then click Kea Apps.
Select an app from the presented apps list. Locate and click the pencil
icon next to the app name in the app view. In the displayed dialog box,
type the new app name. If the specified name is valid, the Rename
button is enabled. Click this button to submit the new name. The Rename
button is disabled if the name is invalid. In this case, a hint is displayed
informing about issues with the new name.
3.5.3. IPv4 and IPv6 Subnets per Kea Application
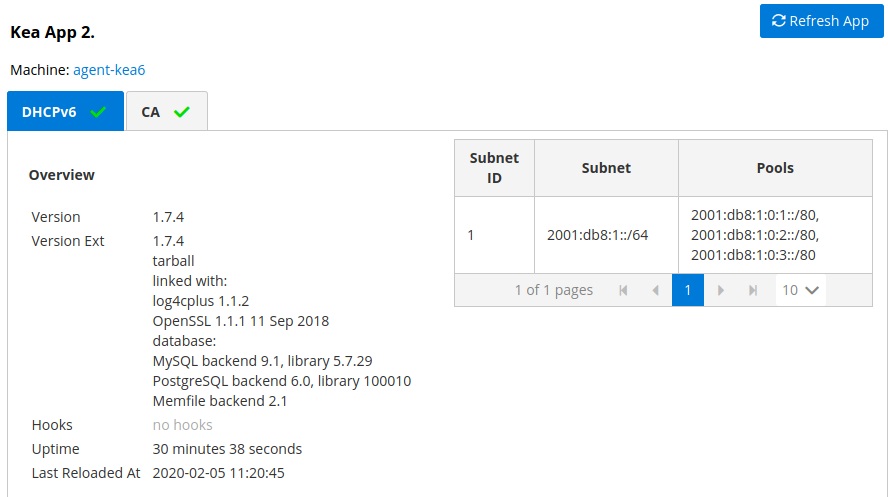
One of the primary configuration aspects of any network is the layout of IP addressing. This is represented in Kea with IPv4 and IPv6 subnets. Each subnet represents addresses used on a physical link. Typically, certain parts of each subnet (“pools”) are delegated to the DHCP server to manage. Stork is able to display this information.
One way to inspect the subnets and pools within Kea is by looking at each Kea application to get an overview of what configurations a specific Kea application is serving. A list of configured subnets on that specific Kea application is displayed. The following picture shows a simple view of the Kea DHCPv6 server running with a single subnet, with three pools configured in it.
3.5.4. IPv4 and IPv6 Subnets in the Whole Network
It is convenient to see the complete overview of all subnets
configured in the network that are being monitored by Stork. Once at least one
machine with the Kea application running is added to Stork, click on
the DHCP menu and choose Subnets to see all available subnets. The
view shows all IPv4 and IPv6 subnets with the address pools and links
to the applications that are providing them. An example view of all
subnets in the network is presented in the figure below.
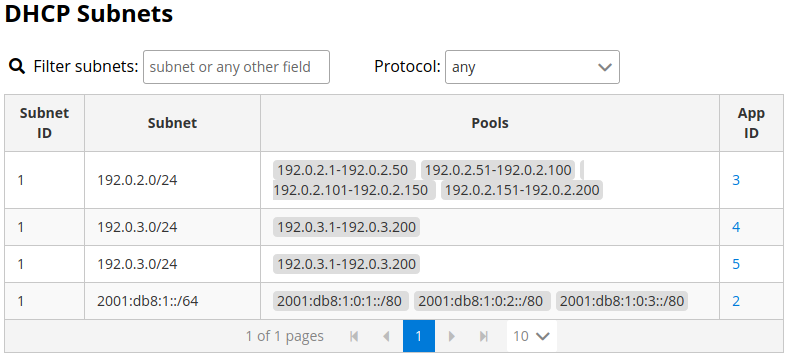
Stork provides filtering capabilities; it is possible to choose whether to see IPv4 only, IPv6 only, or both. There is also an omnisearch box available where users can type a search string. Note that for strings of four characters or more, the filtering takes place automatically, while shorter strings require the user to hit Enter. For example, in the above example it is possible to show only the first (192.0.2.0/24) subnet by searching for the 0.2 string. One can also search for specific pools, and easily filter the subnet with a specific pool, by searching for part of the pool ranges, e.g. 3.200.
Stork displays pool utilization for each subnet, with the absolute number of addresses allocated and usage percentage. There are two thresholds: 80% (warning; the pool utilization bar turns orange) and 90% (critical; the pool utilization bar turns red).
3.5.5. IPv4 and IPv6 Networks
Kea uses the concept of a shared network, which is essentially a stack
of subnets deployed on the same physical link. Stork
retrieves information about shared networks and aggregates it across all
configured Kea servers. The Shared Networks view allows for the
inspection of networks and the subnets that belong in them. Pool
utilization is shown for each subnet.
3.5.6. Host Reservations
3.5.6.1. Listing Host Reservations
Kea DHCP servers can be configured to assign static resources or parameters to the DHCP clients communicating with the servers. Most commonly these resources are the IP addresses or delegated prefixes. However, Kea also allows for assigning hostnames, PXE boot parameters, client classes, DHCP options, and other parameters. The mechanism by which a given set of resources and/or parameters is associated with a given DHCP client is called “host reservations.”
A host reservation consists of one or more DHCP identifiers used to associate the reservation with a client, e.g. MAC address, DUID, or client identifier; and a collection of resources and/or parameters to be returned to the client if the client’s DHCP message is associated with the host reservation by one of the identifiers. Stork can detect existing host reservations specified both in the configuration files of the monitored Kea servers and in the host database backends accessed via the Kea Host Commands premium hooks library. At present, Stork provides no means to update or delete host reservations.
All reservations detected by Stork can be listed by selecting the DHCP
menu option and then selecting Hosts.
The first column in the presented view displays one or more DHCP identifiers
for each host in the format hw-address=0a:1b:bd:43:5f:99, where
hw-address is the identifier type. In this case, the identifier type is
the MAC address of the DHCP client for which the reservation has been specified.
Supported identifier types are described in the following sections of the Kea
Administrator Reference Manual (ARM):
Host Reservation in DHCPv4
and Host Reservation in DHCPv6.
If multiple identifiers are present for a reservation, the reservation is
assigned when at least one of the identifiers matches the received DHCP packet.
The second column, IP Reservations, includes the static assignments of the
IP addresses and/or delegated prefixes to the clients. There may be one or
more IP reservations for each host.
The Hostname column contains an optional hostname reservation, i.e., the
hostname assigned to the particular client by the DHCP servers via the
Hostname or Client FQDN option.
The Global/Subnet column contains the prefixes of the subnets to which the reserved
IP addresses and prefixes belong. If the reservation is global, i.e., is valid
for all configured subnets of the given server, the word “global” is shown
instead of the subnet prefix.
Finally, the App Name column includes one or more links to
Kea applications configured to assign each reservation to the
client. The number of applications is typically greater than one
when Kea servers operate in the High Availability setup. In this case,
each of the HA peers uses the same configuration and may allocate IP
addresses and delegated prefixes to the same set of clients, including
static assignments via host reservations. If HA peers are configured
correctly, the reservations they share will have two links in the
App Name column. Next to each link there is a little label indicating
whether the host reservation for the given server has been specified
in its configuration file or a host database (via the Host Commands premium
hooks library).
The Filter hosts input box is located above the Hosts table. It
allows the hosts to be filtered by identifier types, identifier values, IP
reservations, and hostnames, and by globality, i.e., is:global and not:global.
When filtering by DHCP identifier values, it is not necessary to use
colons between the pairs of hexadecimal digits. For example, the
reservation hw-address=0a:1b:bd:43:5f:99 will be found
whether the filtering text is 1b:bd:43 or 1bbd43.
3.5.6.2. Host Reservation Usage Status
Clicking on a selected host in the host reservations list will open a new tab presenting host details. The tab also comprises the information about the reserved addresses and delegated prefixes usage. Stork needs to query Kea servers to gather the lease information for each address and prefix in the selected reservation. It may take several seconds or longer before this information is available. The lease information can be refreshed using the Leases button at the bottom of the tab.
The usage status is shown next to each IP address and delegated prefix. Possible statuses and their meanings are listed in the table below.
| Status | Meaning |
|---|---|
in use |
There are valid leases assigned to the client. The client
owns the reservation, or the reservation includes flex-id
or circuit-id identifier making it impossible to detect
conflicts (see note below). |
expired |
At least one of the leases assigned to the client owning the reservation is expired. |
declined |
The address is declined in at least one of the Kea servers. |
in conflict |
At least one of the leases for the given reservation is assigned to a client who does not own this reservation. |
unused |
There are no leases for the given reservation. |
Expand selected address or delegated prefix row to view status details. Clicking on the selected address or delegated prefix navigates to the leases search page, where all leases associated with the address or prefix can be listed.
Note
Detecting in conflict status is currently not supported for host
reservations with flex-id or circuit-id identifiers. If there are
valid leases for such reservations, they are marked in use regardless
if the conflict exists or not.
3.5.6.3. Sources of Host Reservations
There are two ways to configure the Kea servers to use host reservations. First,
the host reservations can be specified within the Kea configuration files; see
Host Reservation in DHCPv4
for details. The other way is to use a host database backend, as described in
Storing Host Reservations in MySQL, PostgreSQL, or Cassandra.
The second solution requires the given Kea server to be configured to use the
host_cmds premium hooks library. This library implements control commands used
to store and fetch the host reservations from the host database which the Kea
server is connected to. If the host_cmds hooks library is not loaded, Stork
only presents the reservations specified within the Kea configuration files.
Stork periodically fetches the reservations from the host database backends and updates them in the local database. The default interval at which Stork refreshes host reservation information is set to 60 seconds. This means that an update in the host reservation database will not be visible in Stork until up to 60 seconds after it was applied. This interval is currently not configurable.
Note
The list of host reservations must be manually refreshed by reloading the browser page to see the most recent updates fetched from the Kea servers.
3.5.7. Leases Search
Stork has a utility to search DHCP leases on monitored Kea servers. It is helpful for troubleshooting issues with a particular IP address or delegated prefix. It is also helpful in resolving lease allocation issues for certain DHCP clients. The search mechanism utilizes Kea control commands to find leases on the monitored servers. An operator must ensure that Kea servers on which he intends to search the leases have the lease_cmds hooks library loaded. Stork does not search leases on the Kea instances without this library.
The leases search is available via the DHCP -> Leases Search menu. Type one
of the searched lease properties in the search box:
- IPv4 address, e.g.
192.0.2.3 - IPv6 address or delegated prefix without prefix length,
2001:db8::1 - MAC address, e.g.
01:02:03:04:05:06 - DHCPv4 Client Identifier, e.g.
01:02:03:04 - DHCPv6 DUID, e.g.
00:02:00:00:00:04:05:06:07 - Hostname, e.g.
myhost.example.org
All identifier types can also be specified using the notation with spaces, e.g. 01 02 03 04 05 06, or the notation with hexadecimal digits only, e.g. 010203040506.
To search all declined leases, type state:declined. Beware that this query may
return a large result if there are many declined leases, and in this case, the query
processing time may also increase.
Searching using partial text is currently unsupported. For example: searching by
partial IPv4 address 192.0.2 is not accepted by the search box. Partial MAC
address 01:02:03 is accepted but will return no results. Specify the complete
MAC address instead, e.g. 01:02:03:04:05:06. Searching leases in states other
than declined is also unsupported. For example, the text state:expired-reclaimed
is not accepted by the search box.
The search utility automatically recognizes the specified lease type property and communicates with the Kea servers to find leases using appropriate commands. Each search attempt may result in several commands to multiple Kea servers. Therefore, it may take several seconds or more before Stork displays the search results. Suppose some Kea servers are unavailable or return an error. In that case, Stork shows leases found on the servers which returned success status, and displays a warning message containing the list of Kea servers that returned an error.
If the same lease is found on two or more Kea servers, the results list contains all that lease occurrences. For example, if there is a pair of servers cooperating via HA hooks library, the servers exchange the lease information, and each of them maintains a copy of the lease database. In that case, the lease search on these servers typically returns two occurrences of the same lease.
To display the detailed lease information click the expand button (>) in the
first column for the selected lease.
3.5.8. Kea High Availability Status
When viewing the details of the Kea application for which High
Availability (HA) is enabled (via the libdhcp_ha.so hooks library), the
High Availability live status is presented and periodically refreshed
for the DHCPv4 and/or DHCPv6 daemon configured as primary or
secondary/standby server. The status is not displayed for the server
configured as an HA backup. See the High Availability section in the
Kea ARM
for details about the roles of the servers within the HA setup.
The following picture shows a typical High Availability status view displayed in the Stork UI.
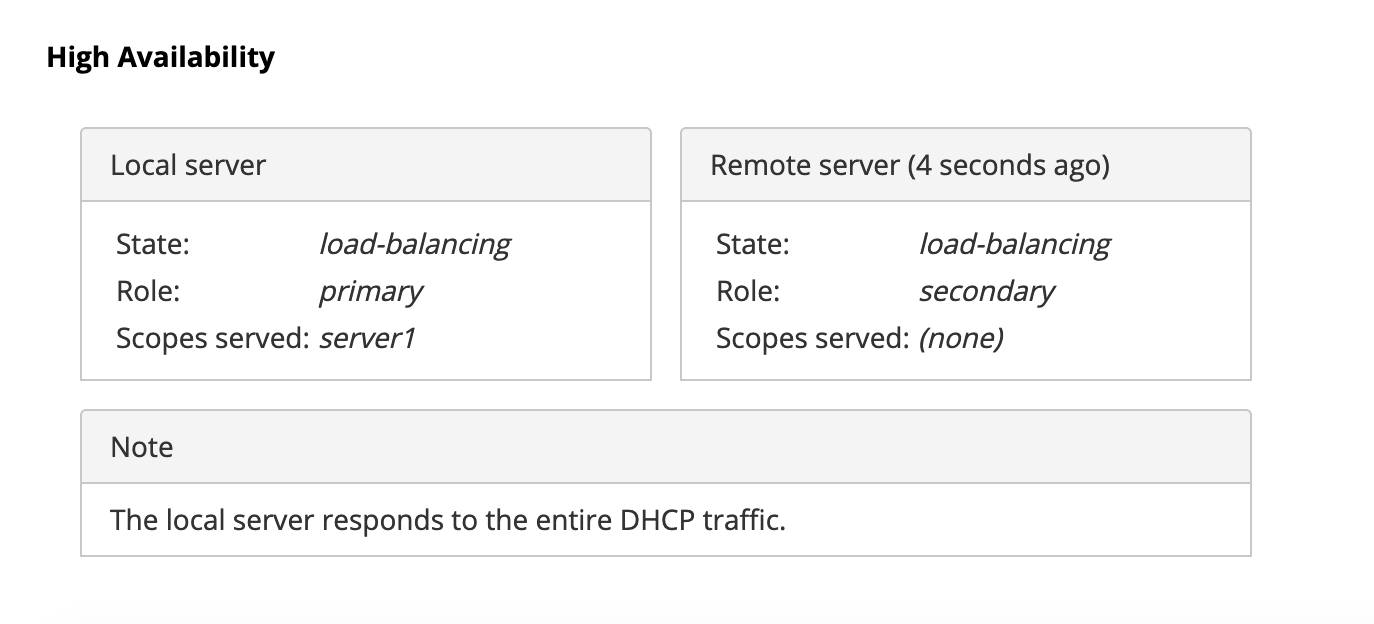
The local server is the DHCP server (daemon) belonging to the
application for which the status is displayed; the remote server is
its active HA partner. The remote server belongs to a different
application running on a different machine, and this machine may or
may not be monitored by Stork. The statuses of both the local and the
remote servers are fetched by sending the status-get
command to the Kea server whose details are displayed (the local
server). In the load-balancing and hot-standby modes, the local server
periodically checks the status of its partner by sending it the
ha-heartbeat command. Therefore, this information is not
always up-to-date; its age depends on the heartbeat command interval
(typically 10 seconds). The status of the remote server includes the
age of the data displayed.
The status information contains the role, state, and scopes served by each HA partner. In the usual HA case, both servers are in load-balancing state, which means that both are serving DHCP clients and there is no failure. If the remote server crashes, the local server transitions to the partner-down state, which will be reflected in this view. If the local server crashes, this will manifest itself as a communication problem between Stork and the server.
As of the Stork 0.8.0 release, the High Availability view may also contain the information about the heartbeat status between the two servers and the information about the failover progress. This information is only available while monitoring Kea version 1.7.8 and later.
The failover progress information is only presented when one of the
active servers has been unable to communicate with the partner via
the heartbeat exchange for a time exceeding the max-heartbeat-delay
threshold. If the server is configured to monitor the DHCP traffic
directed to the partner, to verify that the partner is not responding
to this traffic before transitioning to the partner-down state, the
number of unacked clients (clients which failed
to get the lease), connecting clients (all clients currently trying
to get the lease from the partner), and analyzed
packets are displayed. The system administrator may use this information
to diagnose why the failover transition has not taken place or when
such a transition is likely to happen.
More about High Availability status information provided by Kea can be found in the Kea ARM.
3.5.9. Viewing the Kea Log
Stork offers a simple log-viewing mechanism to diagnose issues with monitored applications.
Note
As of the Stork 0.10 release, this mechanism only supports viewing Kea log files; viewing BIND 9 logs is not yet supported. Monitoring other logging locations such as: stdout, stderr or syslog is also not supported.
Kea can be configured to log into multiple destinations. Different types
of log messages may be output into different log files, syslog, stdout,
or stderr. The list of log destinations used by the Kea application
is available on the Kea App page. Click on the Kea app to view its logs.
Next, select the Kea daemon by clicking on one of the
tabs, e.g. the DHCPv4 tab. Scroll down to the Loggers section.
This section contains a table with a list of configured loggers for the selected daemon. For each configured logger, the logger’s name, logging severity, and output location are presented. The possible output locations are: log file, stdout, stderr, or syslog. It is only possible to view the logs output to the log files. Therefore, for each log file there is a link which leads to the log viewer showing the selected file’s contents. The loggers which output to the stdout, stderr, and syslog are also listed, but links to the log viewer are not available for them.
Clicking on the selected log file navigates to its log viewer. By default, the viewer displays the tail of the log file, up to 4000 characters. Depending on the network latency and the size of the log file, it may take several seconds or more before the log contents are fetched and displayed.
The log viewer title bar comprises three buttons. The button with the refresh
icon triggers log data fetch without modifying the size of the presented
data. Clicking on the + button extends the size of the viewed log tail
by 4000 characters and refreshes the data in the log viewer. Conversely,
clicking on the - button reduces the amount of presented data by
4000 characters. Every time any of these buttons is clicked, the viewer
discards the currently presented data and displays the latest part of the
log file tail.
Please keep in mind that extending the size of the viewed log tail may cause slowness of the log viewer and network congestion as the amount of data fetched from the monitored machine increases.
3.5.10. Viewing the Kea Configuration as JSON Tree
Kea uses JSON (JavaScript Object Notation) to represent its configuration in the configuration files and the command channel. Parts of the Kea configuration held in the Config Backend are also converted to JSON and returned over the control channel in that format. Diagnostics of issues with a particular server often begins by inspecting its configuration.
In the Kea App view, select a tab appropriate for the daemon which
configuration you want to inspect. Click on the Raw Configuration
button. The displayed tree view comprises the selected daemon’s
configuration fetched using the Kea config-get command.
Note
The config-get command returns the configuration presently used
by the selected Kea server. It is a combination of the configuration
read from the configuration file and the Config Backend, if Kea uses
the backend. Therefore, the configuration tree presented in Stork may
differ (sometimes significantly) from the configuration file contents.
The nodes with complex data types can be individually expanded and
collapsed. All nodes can also be expanded using the Expand button.
Click this button again to collapse all nodes. When expanding the nodes
with many sub-nodes, they may be paginated to avoid degrading browser
performance.
Click the Refresh button to fetch and display the latest configuration.
Click Download to download the entire configuration into a text file.
Note
Some of the configuration fields may contain sensitive data (e.g. passwords or tokens). The content of these fields is hidden, and a placeholder is shown. Configurations downloaded as JSON files by users other than super admins contain null values in place of the sensitive data.
3.6. Dashboard
The main Stork page presents a dashboard. It contains a panel with information about DHCP and a panel with events observed or noticed by the Stork server.
3.6.1. DHCP Panel
The DHCP panel includes two sections: one for DHCPv4 and one for DHCPv6. Each section contains three kinds of information:
- a list of up to five subnets with the highest pool utilization
- a list of up to five shared networks with the highest pool utilization
- statistics about DHCP
3.6.2. Events Panel
The Events panel presents the list of the most recent events captured by the Stork server. There are three event urgency levels: info, warning and error. Events pertaining to the particular entities, e.g. machines or applications, provide a link to a web page containing the information about the given object.
3.7. Events Page
The Events page presents a list of all events. It allows events to be filtered by:
- urgency level
- machine
- application type (Kea, BIND 9)
- daemon type (DHCPv4, DHCPv6, named, etc.)
- the user who caused given event (available only to users in the
super-admingroup)