2. Using Stork
This section describes how to use features available in stork. To connect to Stork, use your web browser and connect to port 4200. If Stork is running on your localhost, you can navigate to http://localhost:4200.
2.1. Managing users
Upon the initial installation the default administrator’s account is created and can be used to
sign in to the system via the web UI. Please use the login admin and password admin to
sign in to the system.
To manage users, click on the Configuration menu and choose Users. You will see a list of
existing users. At the very least, there will be user admin.
To add new user, click Create User Account. A new tab will opened that will let you specify the
new account parameters. Some fields have specific restrictions. Username can consist of only
letters, numbers and underscore. E-mail field is optional. However, if specified, it must be a well
formed e-mail. First and lastname fields are mandatory. Password must only contain letters, digits,
@, ., !, +, - and must be at least 8 characters long.
Currently, the users are be associated with one of the two predefined groups (roles),
i.e. super-admin or admin, which must be selected when the user account is created. The
users belonging to the super-admin group are granted full privileges in the system, including
creation and management of user accounts. The admin group has similar privileges, except that
the users belonging to this group are not allowed to manage other users’ accounts.
Once the new user account information has been specified and all requirements are met, the
Save button will become active and you will be able to add new account.
2.2. Changing User Password
Initial password is assigned by the administrator when the user account is created.
Each user should change the password when he or she first logs in to the system.
Click on the Profile menu and choose Settings. The user profile information
is displayed. Click on Change password in the menu bar on the left. In the first
input box the current password must be specified. The new password must be specified
in the second input box and this password must meet the normal requirements for the
password as mentioned in the previous sections. Finally, the password must be confirmed
in the third input box. When all entered data is valid the Save button will be
activated. Clicking this button will attempt to change the password.
2.3. Deploying Stork Agent
Stork system uses agents to monitor services. Stork Agent (STAG or simply agent) is a daemon that is expected to be deployed and run on each machine to be monitored. Currently, there are no automated deployment routines and STAG has to be copied and run manually. This can be done in a variety of ways. Here is one of them.
Assuming you want to monitor services running on machine with IP 192.0.2.1, you can do the following on the Stork server command line:
cd <stork-dir>
scp backend/cmd/stork-agent login@192.0.2.1:/path
On the machine to be monitored, you need to start the agent. In the basic case, you can simply run it:
./stork-agent
You can optionally pass --host= or set the STORK_AGENT_ADDRESS environment variable to
specify which address the agent will listen on. You can pass --port or set the STORK_AGENT_PORT
environment variable to specify which TCP port the agent will listen on.
Note
Unless explicitly specified, the agent will listen on all addresses on port 8080. There are no authentication mechanisms implemented in the agent yet. Use with care!
2.4. Connecting and Monitoring Machines
2.4.1. Registering New Machine
Once the agent is deployed and running on the machine to be monitored, you should instruct Stork server to start monitoring it. You can do so by going to Services menu and choosing Machines. You will be presented with a list of currently registered machines.
To add a new machine, click Add New Machine. You need to specify the machine address or hostname
and a port. If Stork agent is running in a container, you should specify the container name as
a machine hostname. If you launched Stork using rake docker_up command you may specify one of
the demo container names, e.g. agent-kea, agent-bind9 etc. The demo agents are running on
port 8080. If the agent you’re connecting to was launched using rake run_agent it will
listen on localhost port 8888.
Once you click Add, the server will attempt to establish gRPC over http/2 connection to the agent. Make sure that any firewalls in between will allow incoming connections to the TCP port specified.
Once a machine is added, a number of parameters, such as hostname, address, agent version, number of CPU cores, CPU load, available total memory, current memory utilization, uptime, OS, platform family, platform name, OS version, kernel, virtualization details (if any), host ID and other information will be displayed.
If any applications, i.e. Kea or/and BIND 9 are detected on this machine, the status of those applications will be displayed and the link will allow for navigating to the application details.
Navigating to the discovered applications is also possible through the Services menu.
2.4.2. Monitoring Machines
To monitor registered machines, go to Services menu and click Machines. A list of currently registered machines will be displayed. Pagination mechanism is available to display larger number of machines.
There is a filtering mechanism that acts as an omnibox. The string typed is searched for an address, agent version, hostname, OS, platform, OS version, kernel version, kernel architecture, virtualization system, host-id fields. The filtering happens once you hit ENTER.
You can inspect the state of a machine by clicking its hostname. A new tab will open with machine details. Multiple tabs can be open at the same time. You can click Refresh state to get updated information.
The machine state can also be refreshed using Action menu. On the machines list, each machine has its own menu. Click on the triple lines button at the right side and choose the Refresh option.
2.4.3. Deleting Machines
To stop monitoring a machine, you can go to the Machines list, find the machine you want to stop
monitoring, click on the triple lines button at the right side and choose Delete. Note this will
terminate the connection between Stork server and the agent running on the machine and the server
will no longer monitor it. However, the Stork agent process will continue running. If you want to
completely shut it down, you need to do so manually, e.g. by connecting to the machine using ssh and
stopping the agent there. One way to achieve that is to issue killall stork-agent command.
2.5. Monitoring Applications
2.5.1. Application Status
Kea and BIND 9 applications discovered on the connected machines can be listed via the top level
menu bar, under Services. You can select between Kea and BIND 9 applications. The list
of applications of the given type comprises the application version, application status and some
machine details. The Action button is also available which allows for refreshing the
information about the application.
The application status comprises a list of daemons belonging to the application. For BIND 9 it
is always only one daemon, named. In case of Kea, several daemons can be presented in the
application status column, typically: DHCPv4, DHCPv6, DDNS and CA (Kea Control Agent). The
listed daemons are those that Stork found in the CA configuration file. The warning sign
will be displayed for those daemons from the CA configuration file that are not running.
In cases when the Kea installation is simply using the default CA configuration file,
which includes configuration of daemons that are never intended to be launched, it is
recommended to remove (or comment out) those configurations to eliminate unwanted
warnings from Stork about inactive daemons.
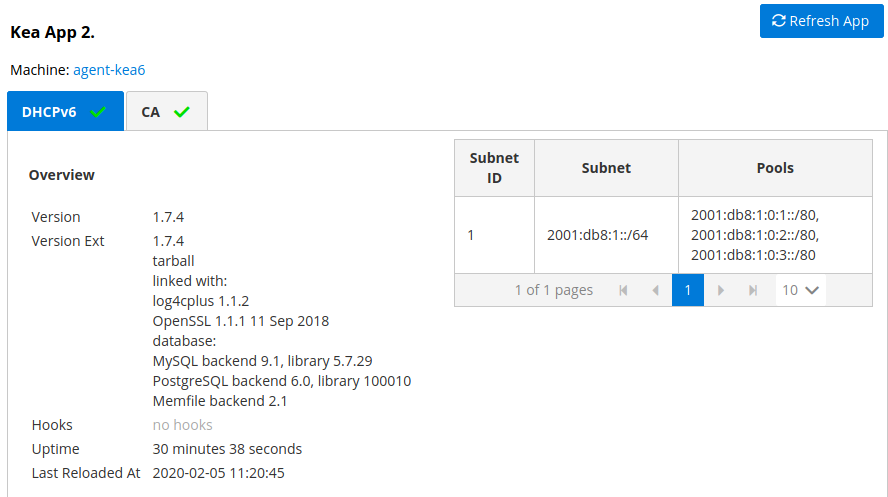
2.5.2. IPv4 and IPv6 Subnets per Kea Application
One of the primary configuration aspects of any network is how the IP addressing is laid out. This is represented in Kea with IPv4 and IPv6 subnets. Each subnet represents addresses being used on a physical link. Typically, certain parts of each subnet (“pools”) are delegated to the DHCP server to manage. Stork is able to display this information. One of the ways to inspect the subnets and pools within is by looking at the Kea applications. This will give you an overview of what kind of configuration this specific Kea application is serving. A list of configured subnets on that specific Kea application will be displayed. The following picture shows a simple view of the Kea DHCPv6 server running with a single subnet with three pools configured in it.
2.5.3. IPv4 and IPv6 Subnets in the whole Network
It is convenient to see the complete overview of all subnets configured in the network being monitored by Stork. To view all subnets, click on DHCP menu and choose Subnets. Note that you should have at least one machine added with Kea application running on it. The view shows all IPv4 and IPv6 subnets with the address pools and the links to applications that are providing them. An example view of all subnets in the network is presented in figure below.
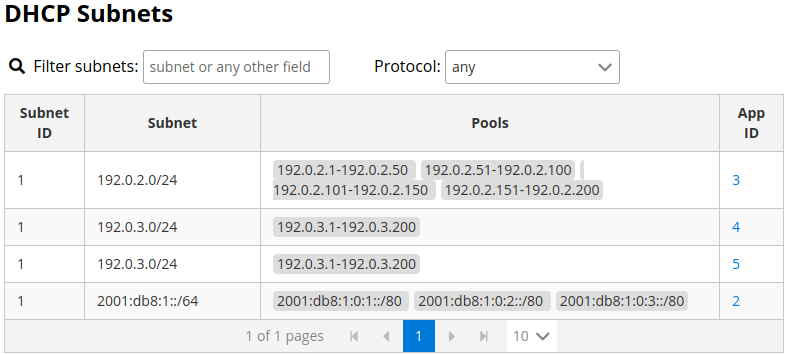
There are filtering capabilities available. You can choose whether you want to see IPv4 only, IPv6 only or both. There is also omnisearch box available. You can type a string you are looking for. Note that for strings of 4 characters and more, the filtering takes place automatically. For shorter strings, you need to also hit Enter. For example, in the above situation you can choose to show only the first (192.0.2.0/24) subnet by searching for 0.2 string. You can also search for specific pools. For example, you can easily filter the subnet with specific pool if you search for part of the pool ranges, e.g. 3.200.
Note
As of 0.4.0, Stork does not support shared networks yet. Also, if there are two or more servers handling the same subnet (e.g. a HA pair), the same subnet will be listed multiple times. Both of these limitations will be addressed in the future releases.
2.5.4. Kea High Availability Status
When viewing the details of the Kea application for which High Availability is enabled (via libdhcp_ha.so hooks library), the High Availability live status is presented and periodically refreshed for the DHCPv4 and/or DHCPv6 deamon configured as primary or secondary/standby server. The status is not displayed for the server configured as a HA backup. See the High Availability section in the Kea ARM for the details about various roles of the servers within the HA setup.
The following picture shows a typical High Availability status view displayed in Stork UI.
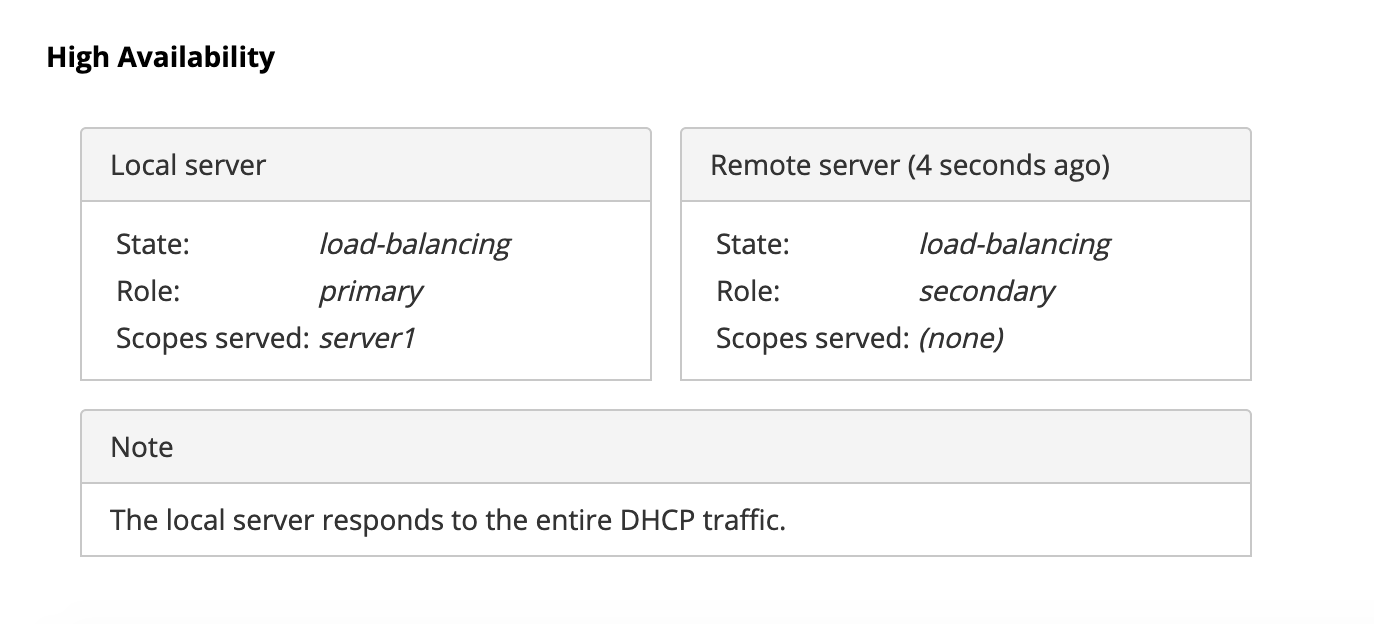
The local server is the DHCP server (daemon) belonging to the application for which
the status is displayed. The remote server is its active HA partner. The remote
server server belongs to a different application running on a different machine
and this machine may or may not be monitored by Stork. The status of both the
local and the remote server is fetched by sending the
status-get
command to the Kea server which details are displayed (local server). The local
server periodically checks the status of its partner by sending the
ha-heartbeat command to it. Therefore this information is not always up to
date and its age depends on the heartbeat command interval (typically 10s). The
status of the remote server includes the age of the data displayed.
The status information contains the role, state and the scopes served by each HA partner. In our case, both servers are in load-balancing state which means that both are serving the DHCP clients and there is no failure. If the remote server crashes, the local server should transition to the partner-down state which will be reflected in this view. If the local server crashes, this will manifest itself as a communication problem between Stork and the server.
2.6. Dashboard
The Main Stork page presents a simple dashboard. It includes some statistics about the monitored applications such as: a total number of Kea and BIND 9 applications and a number of misbehaving applications.